Zing Forum

Reading

ChartAct: A New Benchmark for Dynamic Chart Understanding

Existing chart understanding benchmarks focus on static charts, but real-world charts are often dynamically interactive. The ChartAct benchmark reveals that even the strongest model Claude-Opus-4.7 has a success rate of only 84.5% on dynamic chart tasks.

图表理解多模态模型动态交互数据可视化GUI agent状态跟踪多步骤推理
Published 2026-05-26 21:15Recent activity 2026-05-27 10:30Estimated read 4 min
ChartAct: A New Benchmark for Dynamic Chart Understanding
1

Section 01

ChartAct Benchmark: New Challenges and Current Status of Dynamic Chart Understanding

Most existing chart understanding benchmarks focus on static charts, but real-world charts are often in dynamically interactive forms. As a new benchmark, ChartAct reveals the limitations of current AI models in dynamic chart tasks: even the strongest model Claude-Opus-4.7 has a success rate of only 84.5%. This benchmark provides an important tool for evaluating dynamic chart understanding capabilities.

2

Section 02

The Gap Between Static and Dynamic Chart Understanding

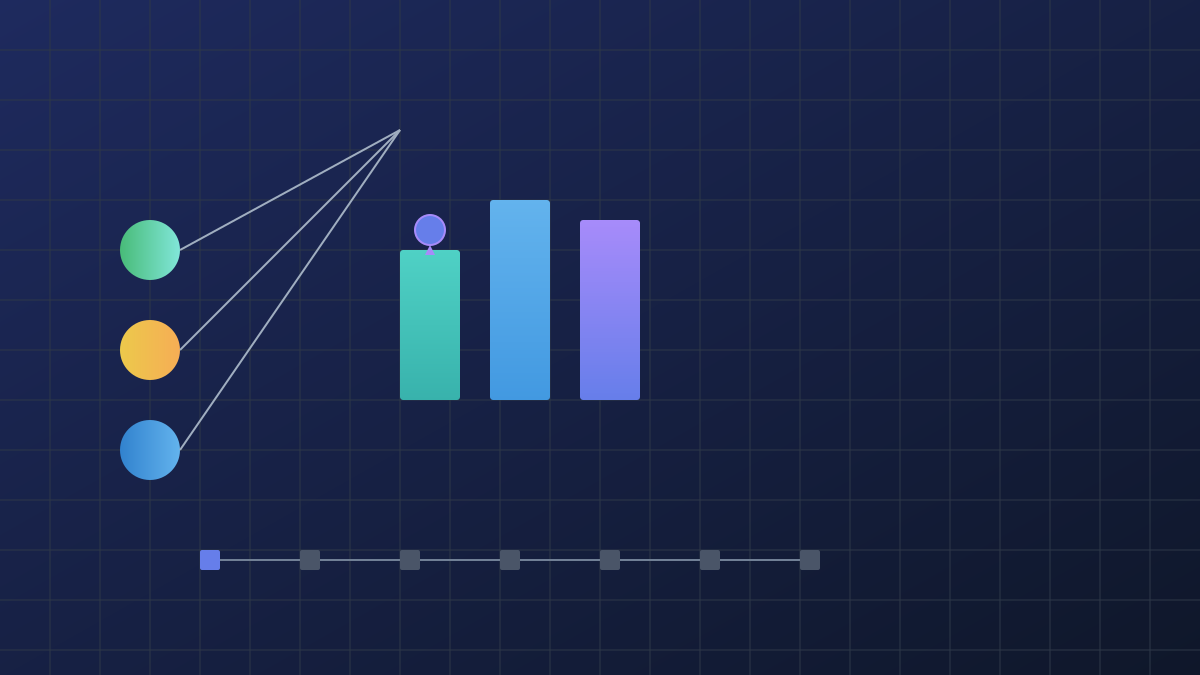
Multimodal AI has made significant progress in static chart understanding, but real-world charts often contain dynamic interactive elements such as hover tips, click-to-expand, and drag-to-adjust. Current AI systems do not perform well on such dynamic tasks, and there is an obvious gap between static and dynamic understanding.

3

Section 03

Design and Core Evaluation Capabilities of the ChartAct Benchmark

ChartAct collected 673 dynamic charts (7 types) from 8 real-world websites and built 1440 Q&A samples. It evaluates in two environments: dynamic charts and dashboards. Core capabilities include: 1. Visible content recognition; 2. Interaction selection (hover/click, etc.); 3. State reasoning (tracking the state after multi-step interactions).

4

Section 04

Experimental Results: Top Models Still Have Significant Limitations

Evaluation of 11 models found: Claude-Opus-4.7 has a success rate of 84.5%, while most models are below 60%; they perform well on simple interactions, but the success rate of multi-step tasks (such as filtering + comparison) is often below 30%; performance in the dashboard environment (multi-chart linkage) is significantly worse.

5

Section 05

Failure Cases: Main Bottlenecks of Dynamic Understanding

Failure cases are attributed to three types of problems: 1. Incorrect interaction selection (selecting non-clickable elements or performing invalid operations); 2. State tracking failure (failing to update cognition after interaction); 3. Premature termination (answering without obtaining complete information).

6

Section 06

Implications and Future Directions of ChartAct

Dynamic chart understanding requires specialized training in interaction selection, state tracking, and multi-step planning; AI needs to improve GUI understanding (including multi-chart linkage); application scenarios include business intelligence, scientific research, news, etc. Current technology requires human supervision, and future efforts need to break through the bottleneck of multi-step reasoning.